GEDmatch now offers the improved AutoClustering tools that will generate AutoTrees from the gedcoms of DNA matches, and if there are high enough DNA matches with extensive trees, additional trees might be generated by AutoPedigree. All of these new features were developed in collaboration with Evert-Jan Blom of Genetic Affairs and are available from the Tier 1 features on GEDmatch. One of these is ‘Clusters, Single Kit input, Basic Version’ but it’s considerable more than the basic cluster GEDmatch used to offer. Another way of using the new AutoTree feature is based on using tag groups in the Tier 1 ‘One-to-Many Comparison Beta.’ Both of these will be examined here.
Clusters, Single Kit input
The first of these is the ‘Clusters, Single Kit input, Basic Version.’ There are now more input parameters than there used to be which allows more control over the results you obtain. The opening screen for the “Clusters” item in Tier 1 is shown in figure 1. The “Work Flow info Toggle” gives suggestions on running your AutoCluster and AutoTree. First you’d want to run the cluster, next go back to the entry screen and run the Auto Tree, and finally go back and run the segment data.
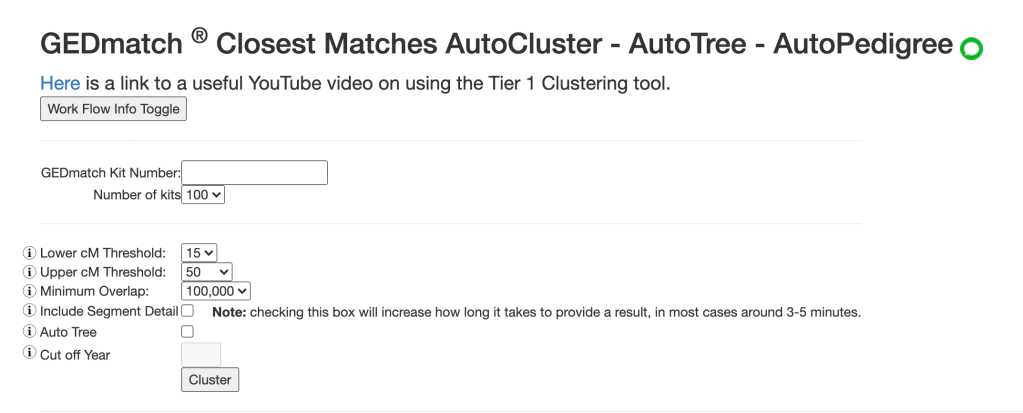
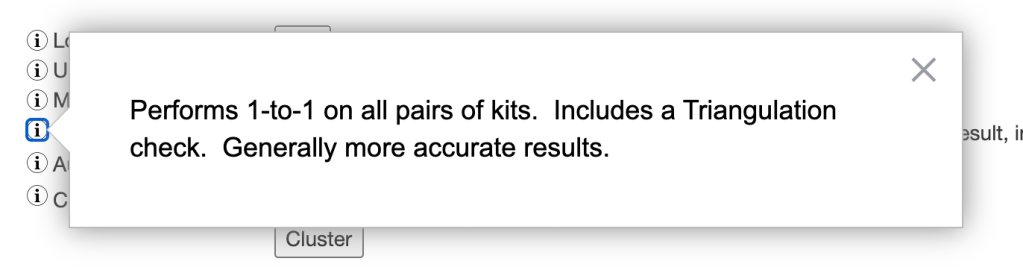
I usually think of the values that appear in the opening screen as a bit of a default for my first run. Number of kits is set to 100. Other options are 250 or 500 kits. The lower threshold is set for 15 cM, which is what I’d likely use. But the upper threshold is 50 cM. I’m not sure that the range 15 – 50 cM would be very useful for most people. I like to set the upper threshold based on what matches I want included in the cluster or which ones I want to exclude. For example, I’d want to include cousin matches, but most likely not want to include siblings or nephews/nieces. The information from the ‘i’ button on ‘minimum overlap’ is shown in figure 2.

This minimum overlap is related to ‘Overlap’ seen in the One-to-Many comparison. Figure 3 shows the One-to-Many for Judy, my sister-in-law.

Overlap numbers that are less than 100,000 are colored various shades of pink or red. Judy tested at 23andMe. Her brother tested at both 23andMe and at Ancestry. Notice how his Ancestry migration – F2 -A is pale pink whereas his 23andMe one is over 100,000. Sister 1 only tested at 23andMe, but sister 2 tested at both Ancestry and 23andMe. All the matches from 23andMe are over 100,000 overlap whereas the ones from Ancestry are not and are pink or red. I definitely want to include matches that tested at other companies in my analyses. To me this is one of the huge benefits of GEDmatch that I can compare matches from different testing companies and especially from Ancestry since they do not provide a chromosome browser. Looking at this list tells me that 40,000 is the value I want to use here for Judy’s data.
‘Include Segment Detail’ “performs 1-to-1 on all pairs of kits. Includes a Triangulation check. Generally more accurate results,” see figure 4. When this analysis is run a triangle appears in matches that triangulate. ‘Auto Tree’ option first will add a tree symbol to your cluster and allow you to see the match’s gedcom pedigree. However, if there are high DNA matches with extensive trees you can also get AutoPedigree.
The ‘Cut off Year’ refers to the earlier date seen in the tree. The default is 1700 CE, but it can be lowered to 1500 CE.
Example
Using my sister-in-law, Judy’s1 GEDmatch data I wanted to include Sue, her 3C1R. Figure 3 shows Sue matches Judy with 92.8 cM in the 1 to many match list. I want to include all the various testing companies so I set the overlap parameter to 40,000. Using 100 kits and running the cluster from 15 cM to 100 cM should include her, but it didn’t. The range of matches that were in the clusters were 26.4 to 27.1 cM. It appears that GEDmatch is using some modification of the clustering algorithm that they used previously which favored the smaller cM values. After trying several combinations of values I obtained a cluster with Sue, Judy’s 3C1R, by using 25 to 500 cM and 40,000 overlap with 100 kits. It’s important to view the cluster order ‘by Cluster number’ in order to get the cleanest results. The clusters for this analysis are shown in figure 5.

One thing you might notice are clusters that are more sparse as compared to other clustering results. This is because the clustering settings have been changed to generate larger clusters. This should improve the identification of common ancestors when they would not be found if the clusters are more condensed.
Next I ran the Auto Tree. In Chrome hitting the back arrow on the browser twice will bring up the original screen with the parameter I’d used intact. Often several more matches are shown in the clusters with Auto Tree, and a tree icon is shown for matches that have a gedcom on GEDmatch. See figure 6.
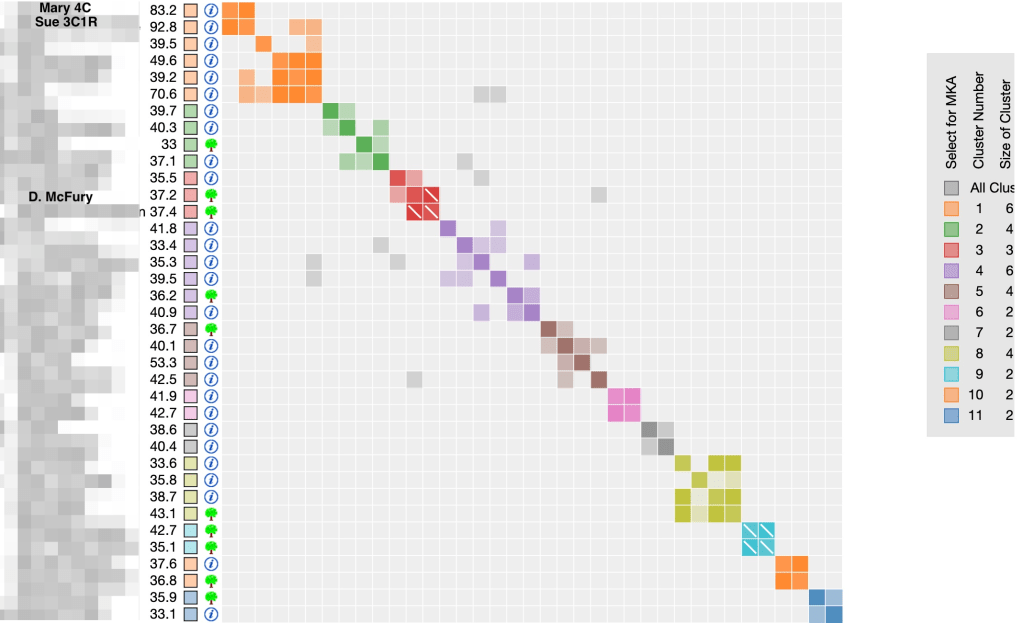
Now both Sue, the 3C1R and her daughter, Mary are showing in the cluster, whereas Mary wasn’t showing in the earlier cluster in figure 5. Neither of them has a gedcom, but I know they are related to Judy through her second great grandparents on her paternal grandmother’s side. There are a number of trees here to explore. I recognized D. McFury surname’s as I’ve seen it with another match on 23andMe. There was no tree on 23andMe so I was very interested to see the gedcom and hopefully figure out the connection to Judy. Part of the gedcom is shown in figure 7. Ellen Talbot is D. McFury’s 2nd great grandmother. Judy’s 2nd great grandmother is Jane Talbot who married Richard Coleman. This match is on her Talbot 2nd great grandmother’s line. Two things in this gedcom jumped out at me. Ellen Talbot was from County Kilkenny, Ireland, which is where my Barry family lived. Kilkenny is the one place in Ireland that I’ve done extensive research. The other is that Ellen’s daughter Nancy Anna died in Kalamazoo County, MI. Judy’s 2nd great grandfather, Richard Coleman lived in Kent County, MI and is buried in Ada, MI which is only about 70 miles (113 km) from Kalamazoo. In fall 2019 I spent a day in Kent County researching the Coleman family and plan a trip back there when I’m visiting in MI and the libraries are open again.
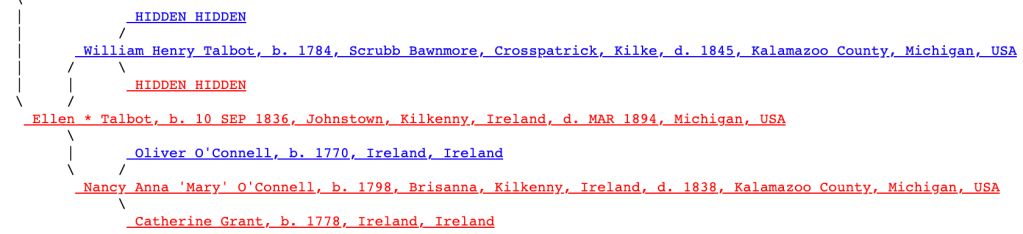
D. McFury shares 35 cM with Judy. Looking at the Shared cM Project on DNA Painter that could be 3rd cousin or perhaps more likely 4th cousin. Now I need to build out the tree and try and find the most recent common ancestor between Jane Talbot and Ellen Talbot.
At the top of the screen with the clusters and trees there are several new options, shown in figure 8.

Selecting the ‘AutoTree AutoCluster Analysis’ tab brings up an explanation of how the AutoCluster and AutoTrees are calculated. At the bottom of this explanation is a table. See figure 9.
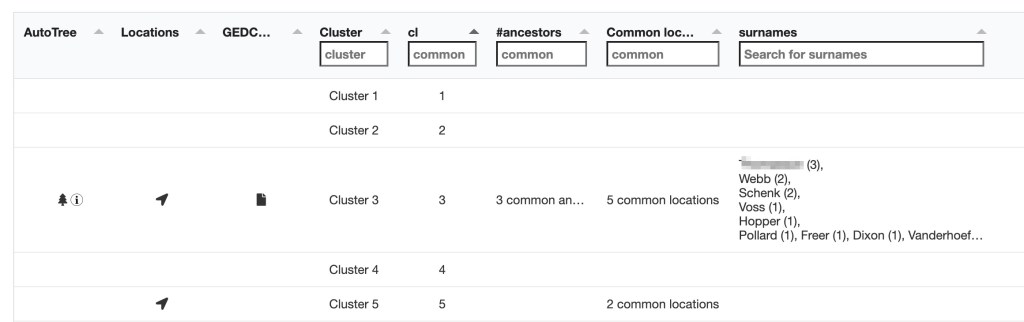
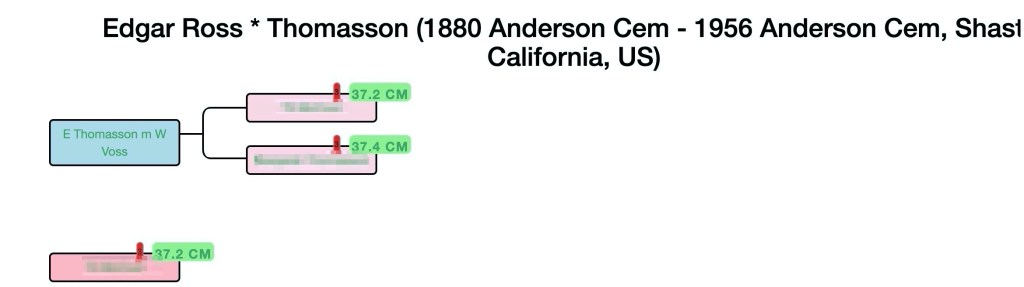
In the table each cluster is listed and any information that has been obtained from the cluster. Looking at cluster 3 the information for the tree icon indicates that clicking on the tree icon will display the tree connecting the matches in the cluster. This tree is shown in figure 10. Location indicates there are 5 locations for this tree. Clicking on the gedcom icon will download a gedcom for this cluster. Surnames lists all the surnames found in gedcom for the cluster.
Below the tree is a list of all the people and locations in more detail, shown in figure 11. The table shows the gedcom number found on GEDmatch, the names of the ancestors, their birth and death location, the descendants, their GEDmatch kit number, their name and the shared cM. All the kit numbers and living people are blocked out for privacy in the figure. Clicking on the location brings up Google map showing the exact location!

Below this table are detailed tables of all the locations found and the ancestors who lived in them for the matches and the primary kit. Figure 12 shows which ancestors from this cluster lived in Grand Rapids, MI, as well as Judy’s ancestors who lived there. These tables add a great deal to the information I’d seen in the gedcom. It lists all the information in one place, as opposed to spread out in the gedcom, and it does the exact comparison of specific locations that are common to the different gedcoms.

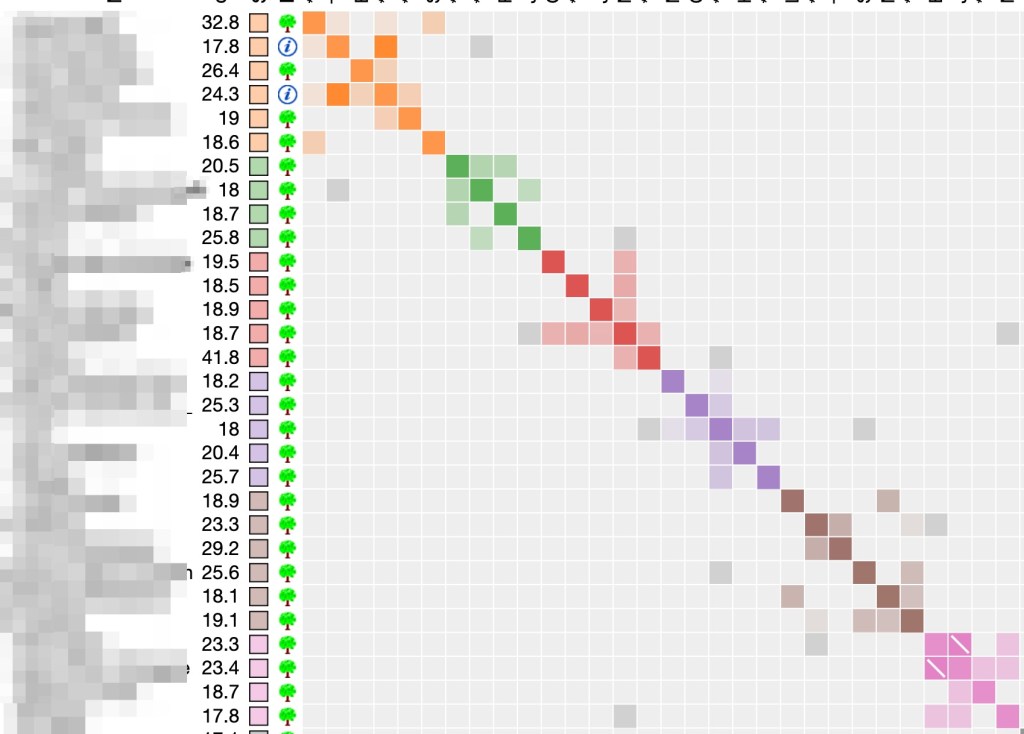
Next I ran the ‘Include Segment Data’. The clusters go back to what was seen for the original clusters but this time with triangles in the clusters to indicate triangulated matches as shown in figure 13.

Sue, who is 3C1R, triangulates with other known cousin who are descendants of Judy’s paternal grandmother’s side of the family. These are seen in the red cluster. The two matches in the first orange cluster triangulate but I do not know how they connect to Judy’s family. The green cluster is on her maternal grandfather’s side, as is the pink cluster. The brown cluster is on her maternal grandmother’s side. The mustard cluster is where D. McFury is and would be on paternal grandfather’s side. Both the turquoise and orange clusters are on maternal grandfather’s side of the family.
Tag Groups
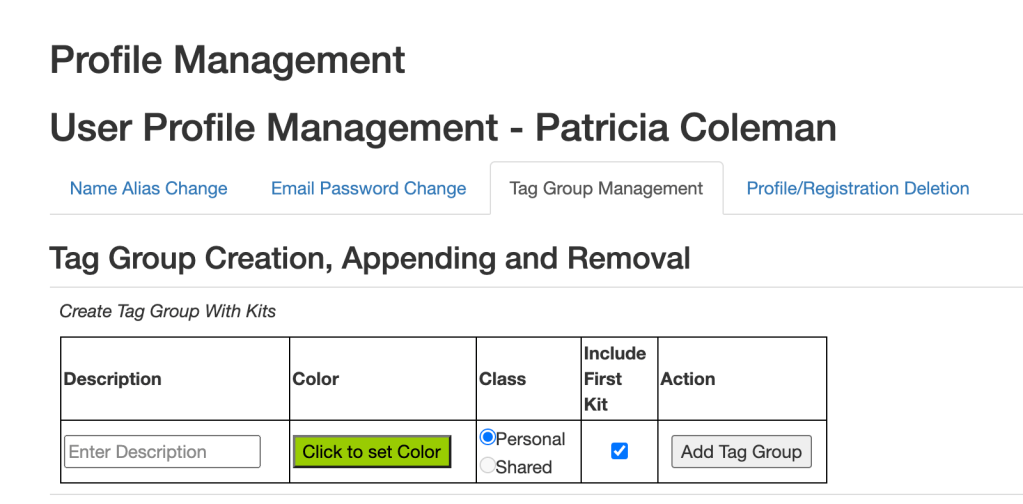
Another method to get AutoTrees and potentially AutoPedigree is based on tag groups. From the home page I selected ‘View/Change/Delete your profile (password, email, groups),’ see figure 14. Then I selected ‘Tag Group Management,’ and figure 15 appeared.

Since I wanted to make a tag group for Judy using her matching kits that contain gedcoms I used Judy1 for the description. I selected green for the color and clicked ‘Add Tag Group.’ Next I went back to the main page by selecting ‘Home’ and select ‘One-to-Many DNA Comparison Beta’ under Tier1. The One-to-Many entry screen is shown in figure 16. After entering Judy’s kit number, I selected 2500 as the ‘limit’ for the number of kits to include and clicked ‘Search.’

Once the list of matching kits is displayed, I clicked ‘Select all with GEDComs.’ That resulted in about 250 matches. Then I selected ‘Visualization Options’ which brings up the screen shown in figure 17, and there I selected ‘Tag Groups’ which let met add the 253 matches that had gedcoms to Judy1 tag group.

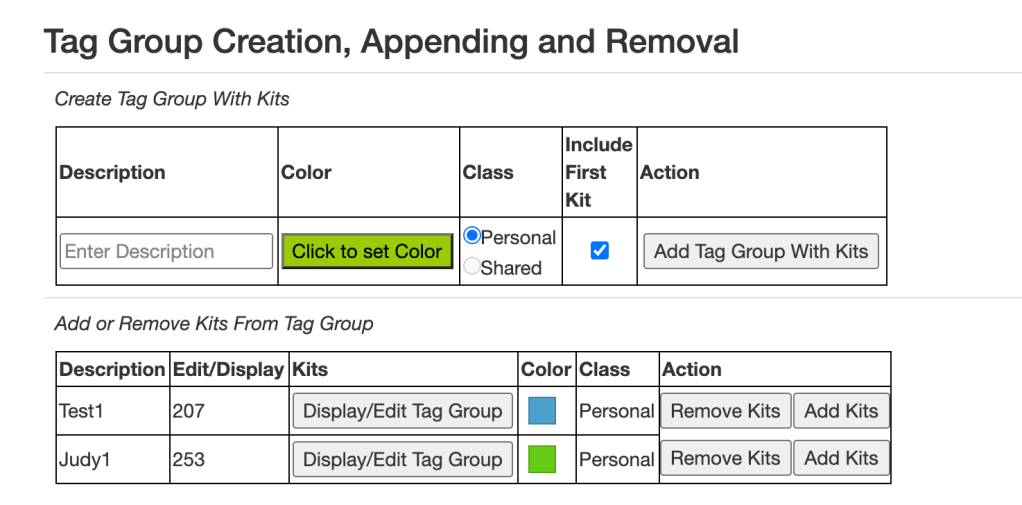
The end results of adding the 253 matches to Judy1 tag group is shown in figure 18.
I next went back to the screen in figure 17 and selected ‘Clustering’ which brings up the screen shown in figure 19.

Since I’ve only included kits that have gedcoms I selected ‘Auto Tree’. I can also select ‘Include Segment Detail’ if I want to see which of the matches triangulate. An ‘Overlap’ of 100,000 would likely only include kits that were tested at 23andMe, which is where Judy tested, so I again changed that to 40,000 in order to include all the testing companies. I’ll used 15 – 1000 cM for the range and selected ‘Cluster’. The top of the resulting screen is shown in figure 20 and the top part of the cluster is shown in figure 21.

Next I looked at the ‘AutoTree AutoCluster Analysis’ tab to get the list showing common ancestors and common locations, as shown in figure 22.

Notice in figure 22 how all of the clusters have locations listed because they all have gecoms, but not all of them show common ancestors. Very often finding ancestors of DNA matches that live in the same location as your ancestors did can help to either make a connection or at least help identify which part of your family is likely in the connection. I decided to look at the tree for cluster 22, which is shown in figure 23.

Looking at the list of common locations associated with cluster 22 and this AutoTree points to the common ancestors that are listed in the table below the AutoTree and shown in figure 24.
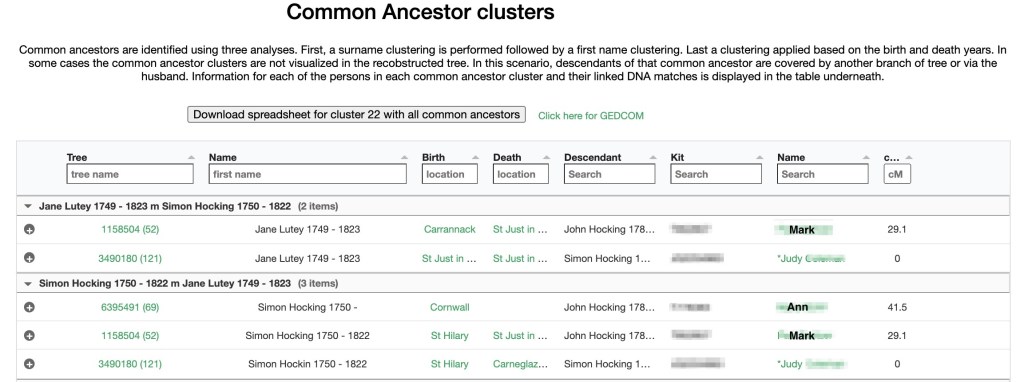
Jane Lutey and Simon Hocking are Judy’s 5th great grandparents. They are also Ann’s and her brother, Mark’s 4th great grandparents. In the AutoTree shown in figure 23 Martha Murrish and James Hocking are Judy’s great grandparents. Judy’s mother was Virginia Hocking. Virginia’s paternal ancestors were miners in Cornwall, England until the mines closed. Some of the miners immigrated to Minnesota, which is what Judy’s great grandparents, Martha Murrish and James Hocking did. Other miners immigrated to Australia, which is what Judy’s 5C1R, Ann’s and Mark’s great grandparents, John Hocking and Margaret Oats, did. John and Margaret are the parents of Caroline Jane Hocking shown in the AutoTree in figure 23. There is a second Hocking line that connects Judy with Ann and Mark, which makes the shared cM value higher than would be expected for a 5C1R. Ann was one of the first matches on GEDmatch that we found, and we’ve been emailing ever since.
Summary
There are two exciting new features on GEDmatch Tier 1 that were developed in collaboration with Evert-Jan Blom of Genetic Affairs. Both of them use your DNA matches and specifically the matches that have gedcoms to find common locations and common ancestors. Both of these techniques have been described in this blog post.
- Judy has given me permission to use her real name. All other names of living people are either hidden or fictitious names have been used. All kit numbers have been hidden.

Leave a comment